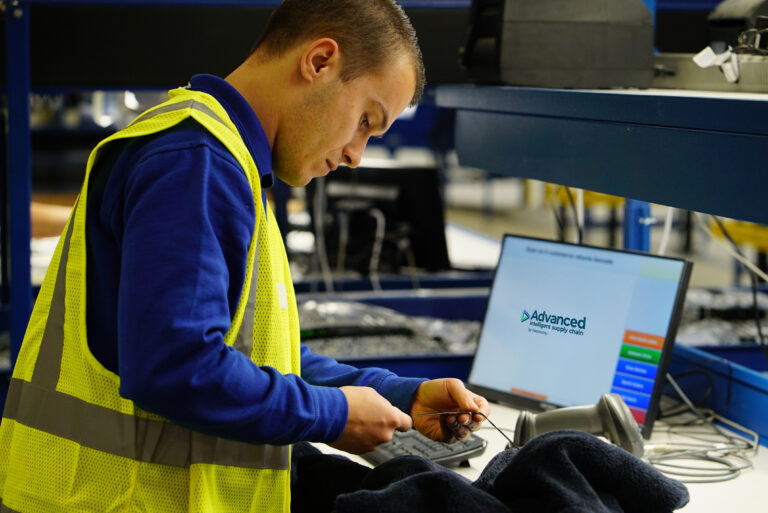

Blue Yonder’s Tyler Chaffo (pictured below) describes to Peter MacLeod how emissions data can be accurately measured using its Emissions Calculator, allowing shippers to make more informed decisions.
Transport emissions are difficult to reduce when companies cannot see clearly where they come from. Freight often passes through multiple carriers, modes, routes and hubs, with each partner holding only part of the picture. A company can set a reduction target, but without reliable activity data it may struggle to know where to start or even whether its actions are working at all.
The scale of the challenge is considerable. The International Energy Agency (IEA) estimates that road freight accounts for around 7% of total energy-related carbon dioxide emissions worldwide. Whilst its 2017 assessment remains a useful indication of the sector’s heft, road transport and freight activity have continued to evolve since those pre-pandemic times.
Building a Baseline
“Most companies now are trying to establish that baseline,” Tyler Chaffo, Sustainable Technology Strategy Manager at Blue Yonder, tells me. “But it’s very manual. They’re requesting data, putting it into Excel, and doing it at a level that may not give them enough insight to decide what to change.”
He described Blue Yonder’s work with a household name global consumer packaged goods (CPG) company. The engagement involved enabling Blue Yonder’s Logistics Emissions Calculator, which is aligned with the Global Logistics Emissions Council (GLEC) Framework. Developed by Smart Freight Centre, the GLEC Framework provides a consistent method for calculating and reporting emissions across freight and logistics. It is also the basis for ISO 14083, the international standard for transport-chain emissions.
The Logistics Emissions Calculator can use different levels of data, from carrier-specific information to modelled or default inputs. It can account for equipment types, modes and multi-leg shipments, and can fill some gaps where a company knows the origin and destination but maybe lacks detail about a particular transport leg. The aim, Chaffo says, is to calculate emissions at a more granular level than is possible using broad spend data.
“If you’re looking at fuel spend, you may be able to do that monthly or annually,” he says. “But it’s difficult to get credible fuel-spend data from carriers for a particular shipment on a particular route.”

From Measurement to Action
Shipment-level information can help teams compare emissions across carriers, routes and modes. But measurement on its own does not reduce emissions. The next step is connecting the information to decisions people are already making. Blue Yonder has integrated the calculator with its transportation management system (TMS) and Blue Yonder Network products which, Chaffo says, lets transport teams view carbon alongside familiar measures such as cost and delivery lead time. In a control tower view, emissions information can also appear alongside the status of planned, moving and delivered shipments.
That integration matters because sustainability teams often depend on other departments to supply operational data. Chaffo says a standalone reporting process can mean repeated requests to carriers and internal transport teams, adding to ‘survey fatigue’ and manual work. Putting emissions information into the tools used by planners and managers makes it easier to access and act on.
It also helps move sustainability from the strategy level out into everyday operations. A company may set a target for reducing emissions, but transport and procurement teams need a way to see how their choices actually affect progress.
“Without the visibility of how their decisions are impacting carbon performance, it becomes really challenging for them to do anything differently,” Chaffo says.
The calculator can show where emissions are occurring and how they trend by mode, lane, country, carrier or customer. When used alongside planning tools, carbon can also become a factor in scenario analysis. A company might compare the cost, route, carrier and emissions associated with different options, or assign an internal value to carbon when evaluating a plan.
That doesn’t necessarily always mean every lower-carbon choice will be cheaper or faster. A shipper may have to weigh a higher freight cost against a lower emissions result, or consider whether a mode shift will still meet specific delivery requirements. Chaffo says the point is to bring any trade-off into clear view so companies can make deliberate choices.
For the CPG company discussed in our conversation, Chaffo described the focus being on enabling the calculator. He said the first step for companies is to establish a baseline, then use that to identify possible changes such as consolidating loads, shifting freight from air to ocean, increasing electric vehicle use on suitable lanes, or considering different fuels.
Chaffo pointed to another example involving a life sciences manufacturer using Blue Yonder transportation management tools. He said route planning and load utilisation improvements had eliminated annually more than 1.4 million unnecessary truck miles (2.25 million km), equivalent to about 56 times around the Earth at the equator or three trips to the moon and back! The example illustrates the potential of operational changes, but the mileage figure alone does not establish a particular emissions reduction.
Making the Business Case
Chaffo says these opportunities can also support the financial case for change. Reducing unnecessary miles, improving vehicle and load utilisation, or using less fuel may lower both operating costs and emissions. The results will depend on the network, the available data and the changes a company makes, but “you need to remove the guesswork” he adds.
Reliable comparisons depend on data quality. Carriers may supply information in different formats or at different levels of detail, and estimated data is not the same as primary data from a shipment or carrier. Chaffo says the calculator’s Accuracy and Clarity features help customers understand what information was used, how a result was calculated and where better inputs could improve it. That transparency is relevant both to internal decisions and to reporting.
For companies at an earlier stage in their carbon reduction journey, Chaffo’s advice is to automate data collection and calculation wherever and whenever possible, as manual spreadsheets can consume time that sustainability and logistics teams could otherwise spend finding improvements. Once that usable baseline exists, companies can then identify where better data or operational changes are likely to have the greatest effect.
The opportunity is not limited to companies already using Blue Yonder’s supply-chain software. Chaffo says the calculator can also be used as a standalone product, with data supplied through integrations or files. He described to me adoption options which are aimed at supporting organisations with differing shipment volumes.
Beyond the Numbers
Freight decarbonisation depends on cooperation across the entire end-to-end supply chain. Shippers need useful information from carriers and logistics service providers and those partners need a consistent way to communicate it. Chaffo sees Blue Yonder’s role as helping facilitate that exchange and leading to more meaningful comparisons.
But better measurement is only the starting point. The acid test is whether companies can use it to shape how freight is planned and moved, and then track whether those changes deliver the hoped-for positive results. Putting emissions information where operational decisions are made closes the gap and now gives transport teams a clearer view of the carbon consequences of the choices they make each day.